
Turbo Eats
Complex Systems

Prompt
Your job is to create an interface for Market Managers -- the people who are responsible for customer satisfaction and profitability in a certain geographic area.
Team
Paola Favela, Shiwen Qin, and Jackie Brandao
Strategies
UX/UI Design, Prototyping
Timeline
1 week
Tools
Figma
Overview
For my Interaction Design and Analysis course at DePaul, my group and I had to design an interface for Market Managers, that helps them view market performance in real-time, collaborate with colleagues, plan, set alerts, etc. The interface would be for Market Managers that work for a thriving startup food delivery service called Turbo Eats. A company that promises to deliver delicious food in 20 minutes or less.
Goals
User: View market performance in real time, understand the “why”, and make adjustments
Business: Deliver food in 20 min or less and increase customer satisfaction
Market Performance Data in Real-Time

We made it easy for market managers to see an overview of relevant data through their dashboard. We included two buttons at the top of the screen, so that they can set alerts and take notes. This will be helpful as managers will be alerted when they need to make interventions or capture notes about potential trends. We also made it easy for market managers to view the overall revenue for the day and external conditions such as weather and traffic that may affect the market health.
The managers can also view data for previous dates using the calendar at the top of the screen. Market managers can use a toggle to switch between data and a map. When the toggle is set to data, the manager gets the detailed information about the orders, kitchens, and drivers. A setting icon was designed to help the manager make a quick adjustment.
Map

As previously mentioned the market managers can easily switch between data and map using the toggle. When the toggle is set to map, the manager can track orders using the car icons on the map. If the manager hovers on the icon, a black rectangle will pop up, which gives the manager a brief version of the order. At the same time, a detailed version of the order will appear on the right side of the map. The manager can call the driver, notify the customer, halt and search an order.
Plan Daily

It’s important for market managers to plan the demand for the following day or week. We included the top bar which includes an overview of last week’s insights. This allows the manager to get a strong understanding of what happened last week and what adjustments are needed for the week being planned. If the manager wants to edit a specific day they have the ability to do so by toggling onto the daily page. They are able to see information from last Monday clearly and can make specific adjustments to the amount of drivers, kitchens, and trucks.
Plan Weekly

Similar to the daily page, the weekly planning page allows the manager to see last week’s complaints, amount of unsold burritos, average time and revenue. This page allows the manager to see previous weeks, both last year and last week in order to better understand why the system is giving them a certain prediction for the upcoming week. It shows the predicted kitchen productivity which also informs the production predictions for next week. Managers have the ability to quickly edit or submit the plans for next week.
Chat
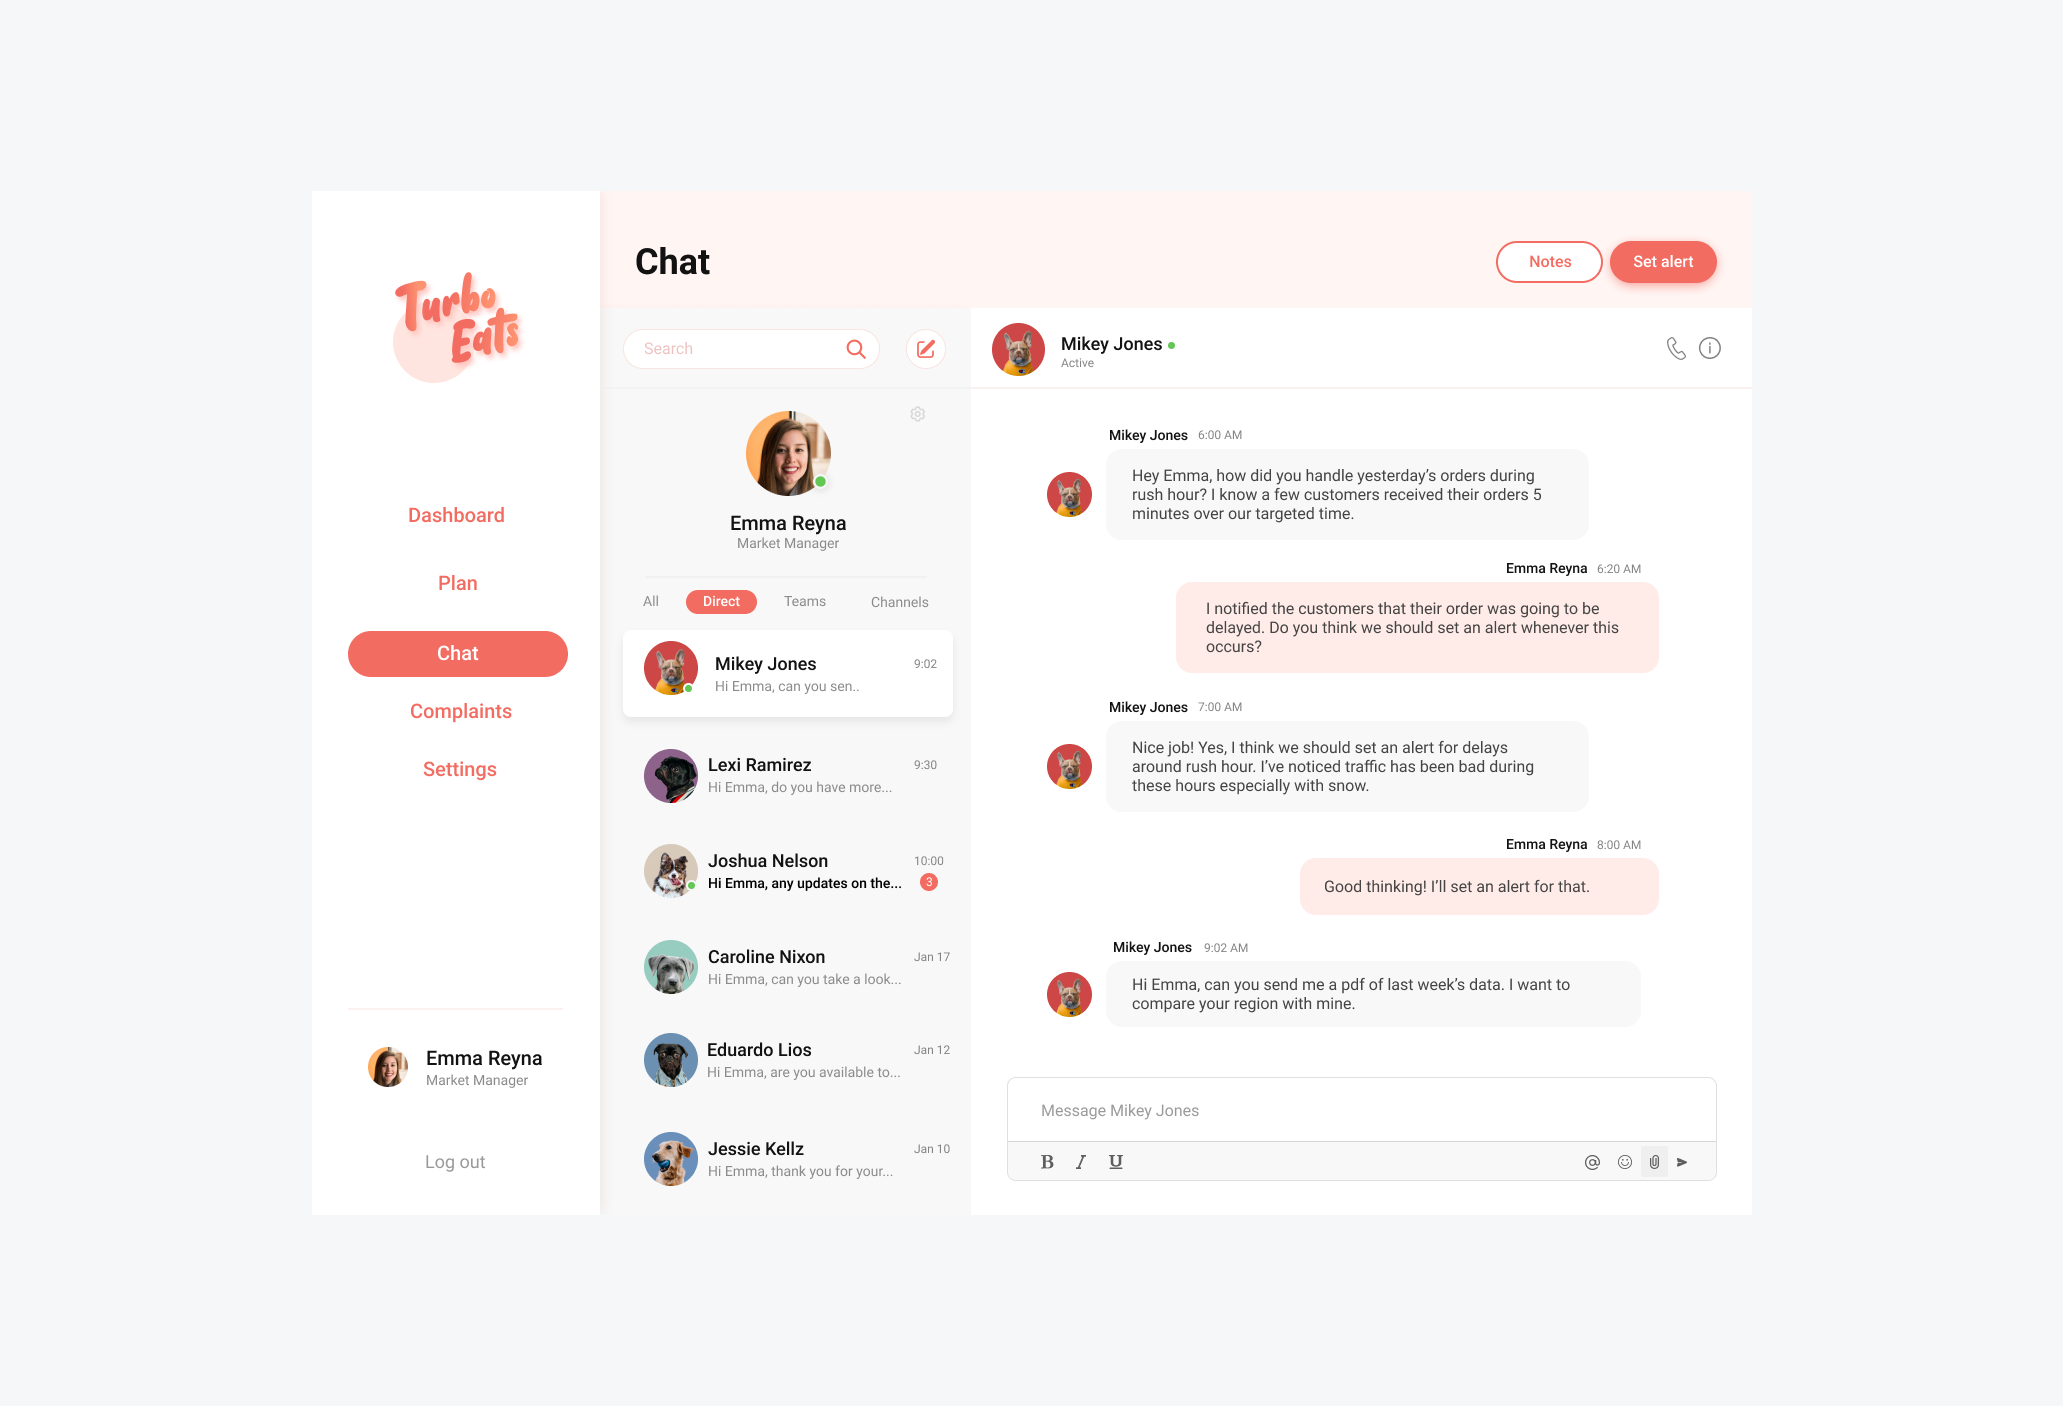
The next page, makes it easy for market managers to communicate and collaborate with other colleagues when making decisions. We made the collaboration process familiar and efficient for market managers. The main features on our chat page provide multiple ways for market managers to stay connected with their team. Market managers can choose what messages they want to view using the filter based tabs which allows them to switch between all, direct, teams and channels.
Complaints

Our complaints page shows the why breakdown of any and all complaints and resolutions received. Managers can easily view complaint and resolution trends over time. They can also see the types of complaints and resolutions. They can see when interventions were needed overall, as well as specific instances. Market managers can also click on a time/complaint or resolution type in order to see a better breakdown of the complaints and overall resolution/escalation journeys.
Reflection
During this project, I knew it was important to present data in an understandable format. Personally, I found that having to understand the data and design it in a way for internal and external purposes was the most challenging aspect about working with complex systems. I also learned how there will be users with various technological backgrounds and may not be proficient when using some tools, and that part of my job as a user experience designer is to think through and test solutions to ensure that the complex system is designed in way that considers different users. That being said, it’s critical to learn about the users in order to understand their needs, goals and pain points when designing a complex system. This project didn’t allow us to interview or test with real users, but it is evident that co-creating with users can be extremely beneficial when designing complex systems.
Next Steps
Eventually, our team believes that the system will use automation and AI to help market managers with planning. For example, the interface will use AI to automate the productivity of the burritos, drivers and trucks needed. This will produce better and more accurate predictions for market managers. AI will also help categorize complaints, so that managers can better understand reoccurring problems.